> ## Documentation Index
> Fetch the complete documentation index at: https://docs.wayak.io/llms.txt
> Use this file to discover all available pages before exploring further.
# What is an ontology?
> How Wayak's semantic layer teaches AI to understand your data like your team does
An ontology is the map of your business logic. It's how you teach Wayak's agent to understand your data the same way a person at your company would — what things are called, how they relate, and what they mean.
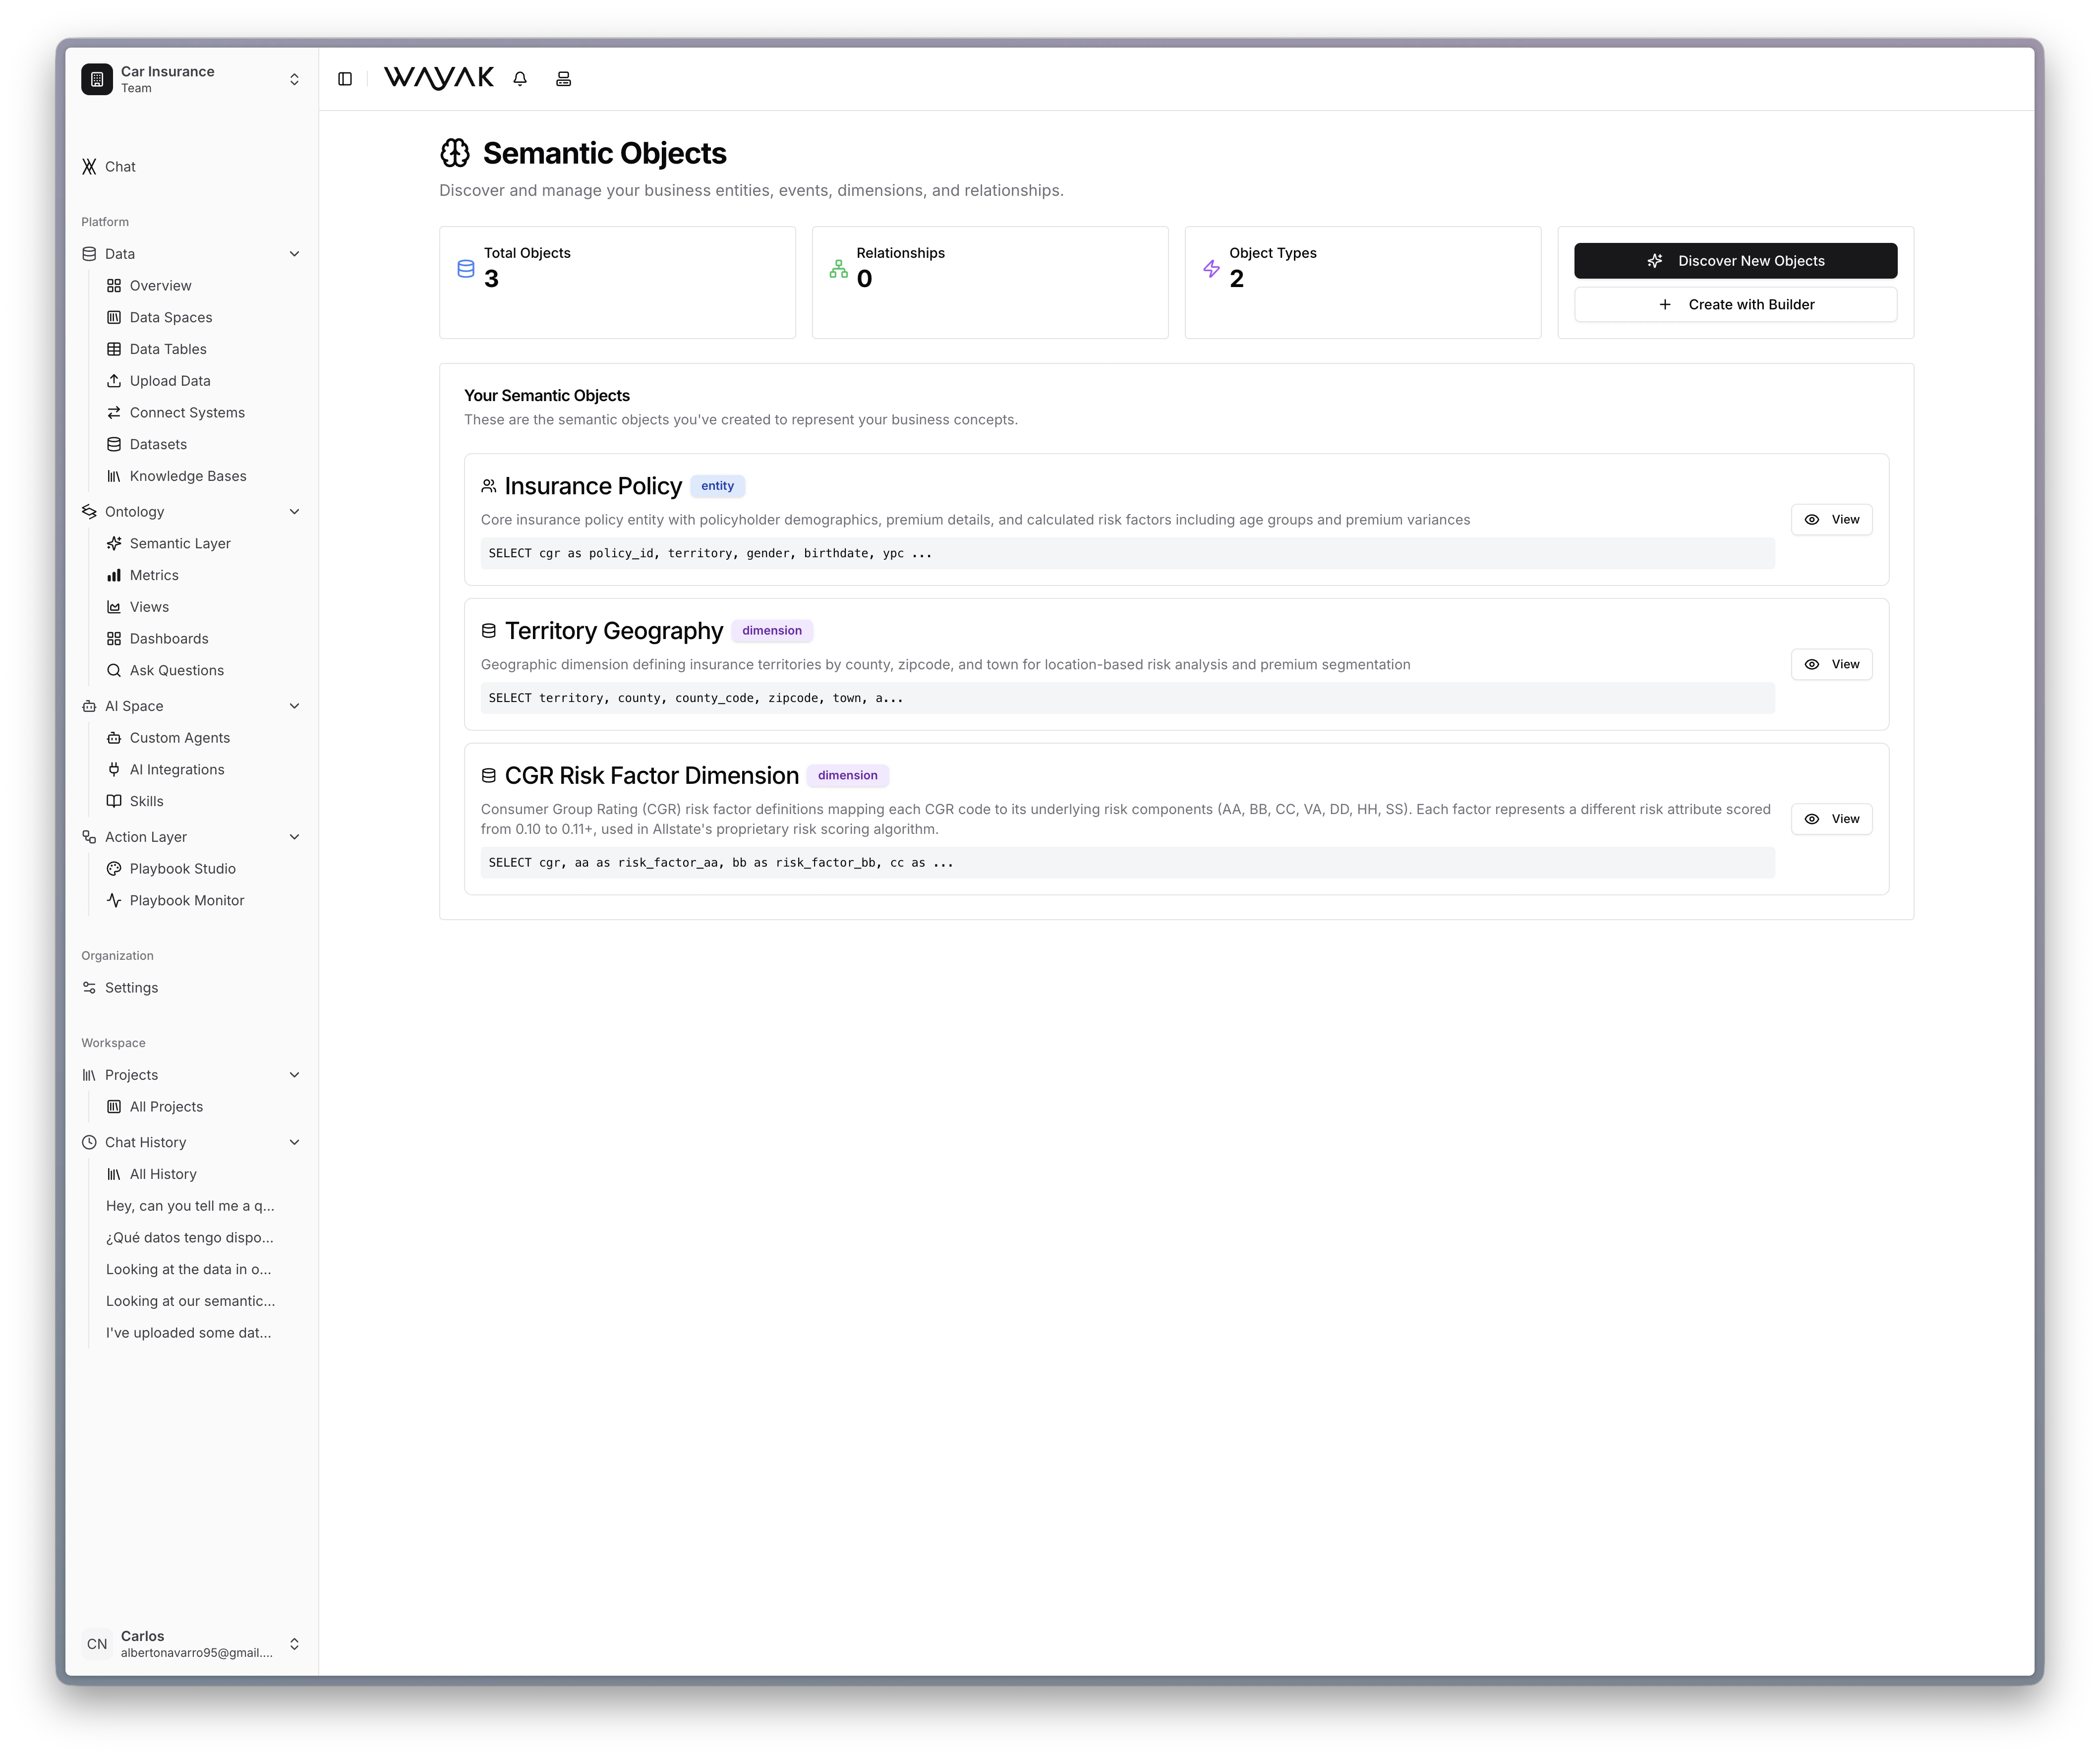
In Wayak, the ontology is the semantic layer. It sits between your raw data and the AI agent, translating business language into precise data operations.
 ***
## Why you need one
***
## Why you need one
### Without an ontology
The agent guesses. A table called `txn_ledger` with a column `amt_net_usd` means nothing without context. Results are inconsistent and unreliable.
### With an ontology
The agent answers with the same precision as your best analyst. It knows "revenue" means `SUM(amt_net_usd) WHERE txn_type = 'sale'` and applies that consistently.
***
## The building blocks
The ontology is made up of six components that work together in a hierarchy:
The core entities in your business — customers, orders, products, employees.
The attributes that describe and categorize your objects — region, status, tier.
Specific instances and how they're identified and resolved across data sources.
The calculations your team cares about — revenue, churn, conversion rate.
Standalone charts and tables that visualize specific slices of your data.
Collections of views assembled into a single, shareable page.
***
## How it all fits together
```mermaid placement="center" theme={null}
flowchart TD
objects[Objects\nCustomers · Orders · Products] --> dimensions[Dimensions\nRegion · Status · Tier]
objects --> entities[Entities\nIdentity Resolution]
objects --> metrics[Metrics\nRevenue · Churn · Conversion]
metrics --> views[Views\nCharts · Tables]
views --> dashboards[Dashboards\nShareable Pages]
```
The agent uses this hierarchy to navigate from a user's question down to the exact data operation needed to answer it.
Start by defining your most important [objects](/concepts/ontology/objects) and [metrics](/concepts/ontology/metrics) — those two alone give the agent enough context to answer most business questions accurately.