> ## Documentation Index
> Fetch the complete documentation index at: https://docs.wayak.io/llms.txt
> Use this file to discover all available pages before exploring further.
# Dashboards
> Assemble views into shareable, at-a-glance pages
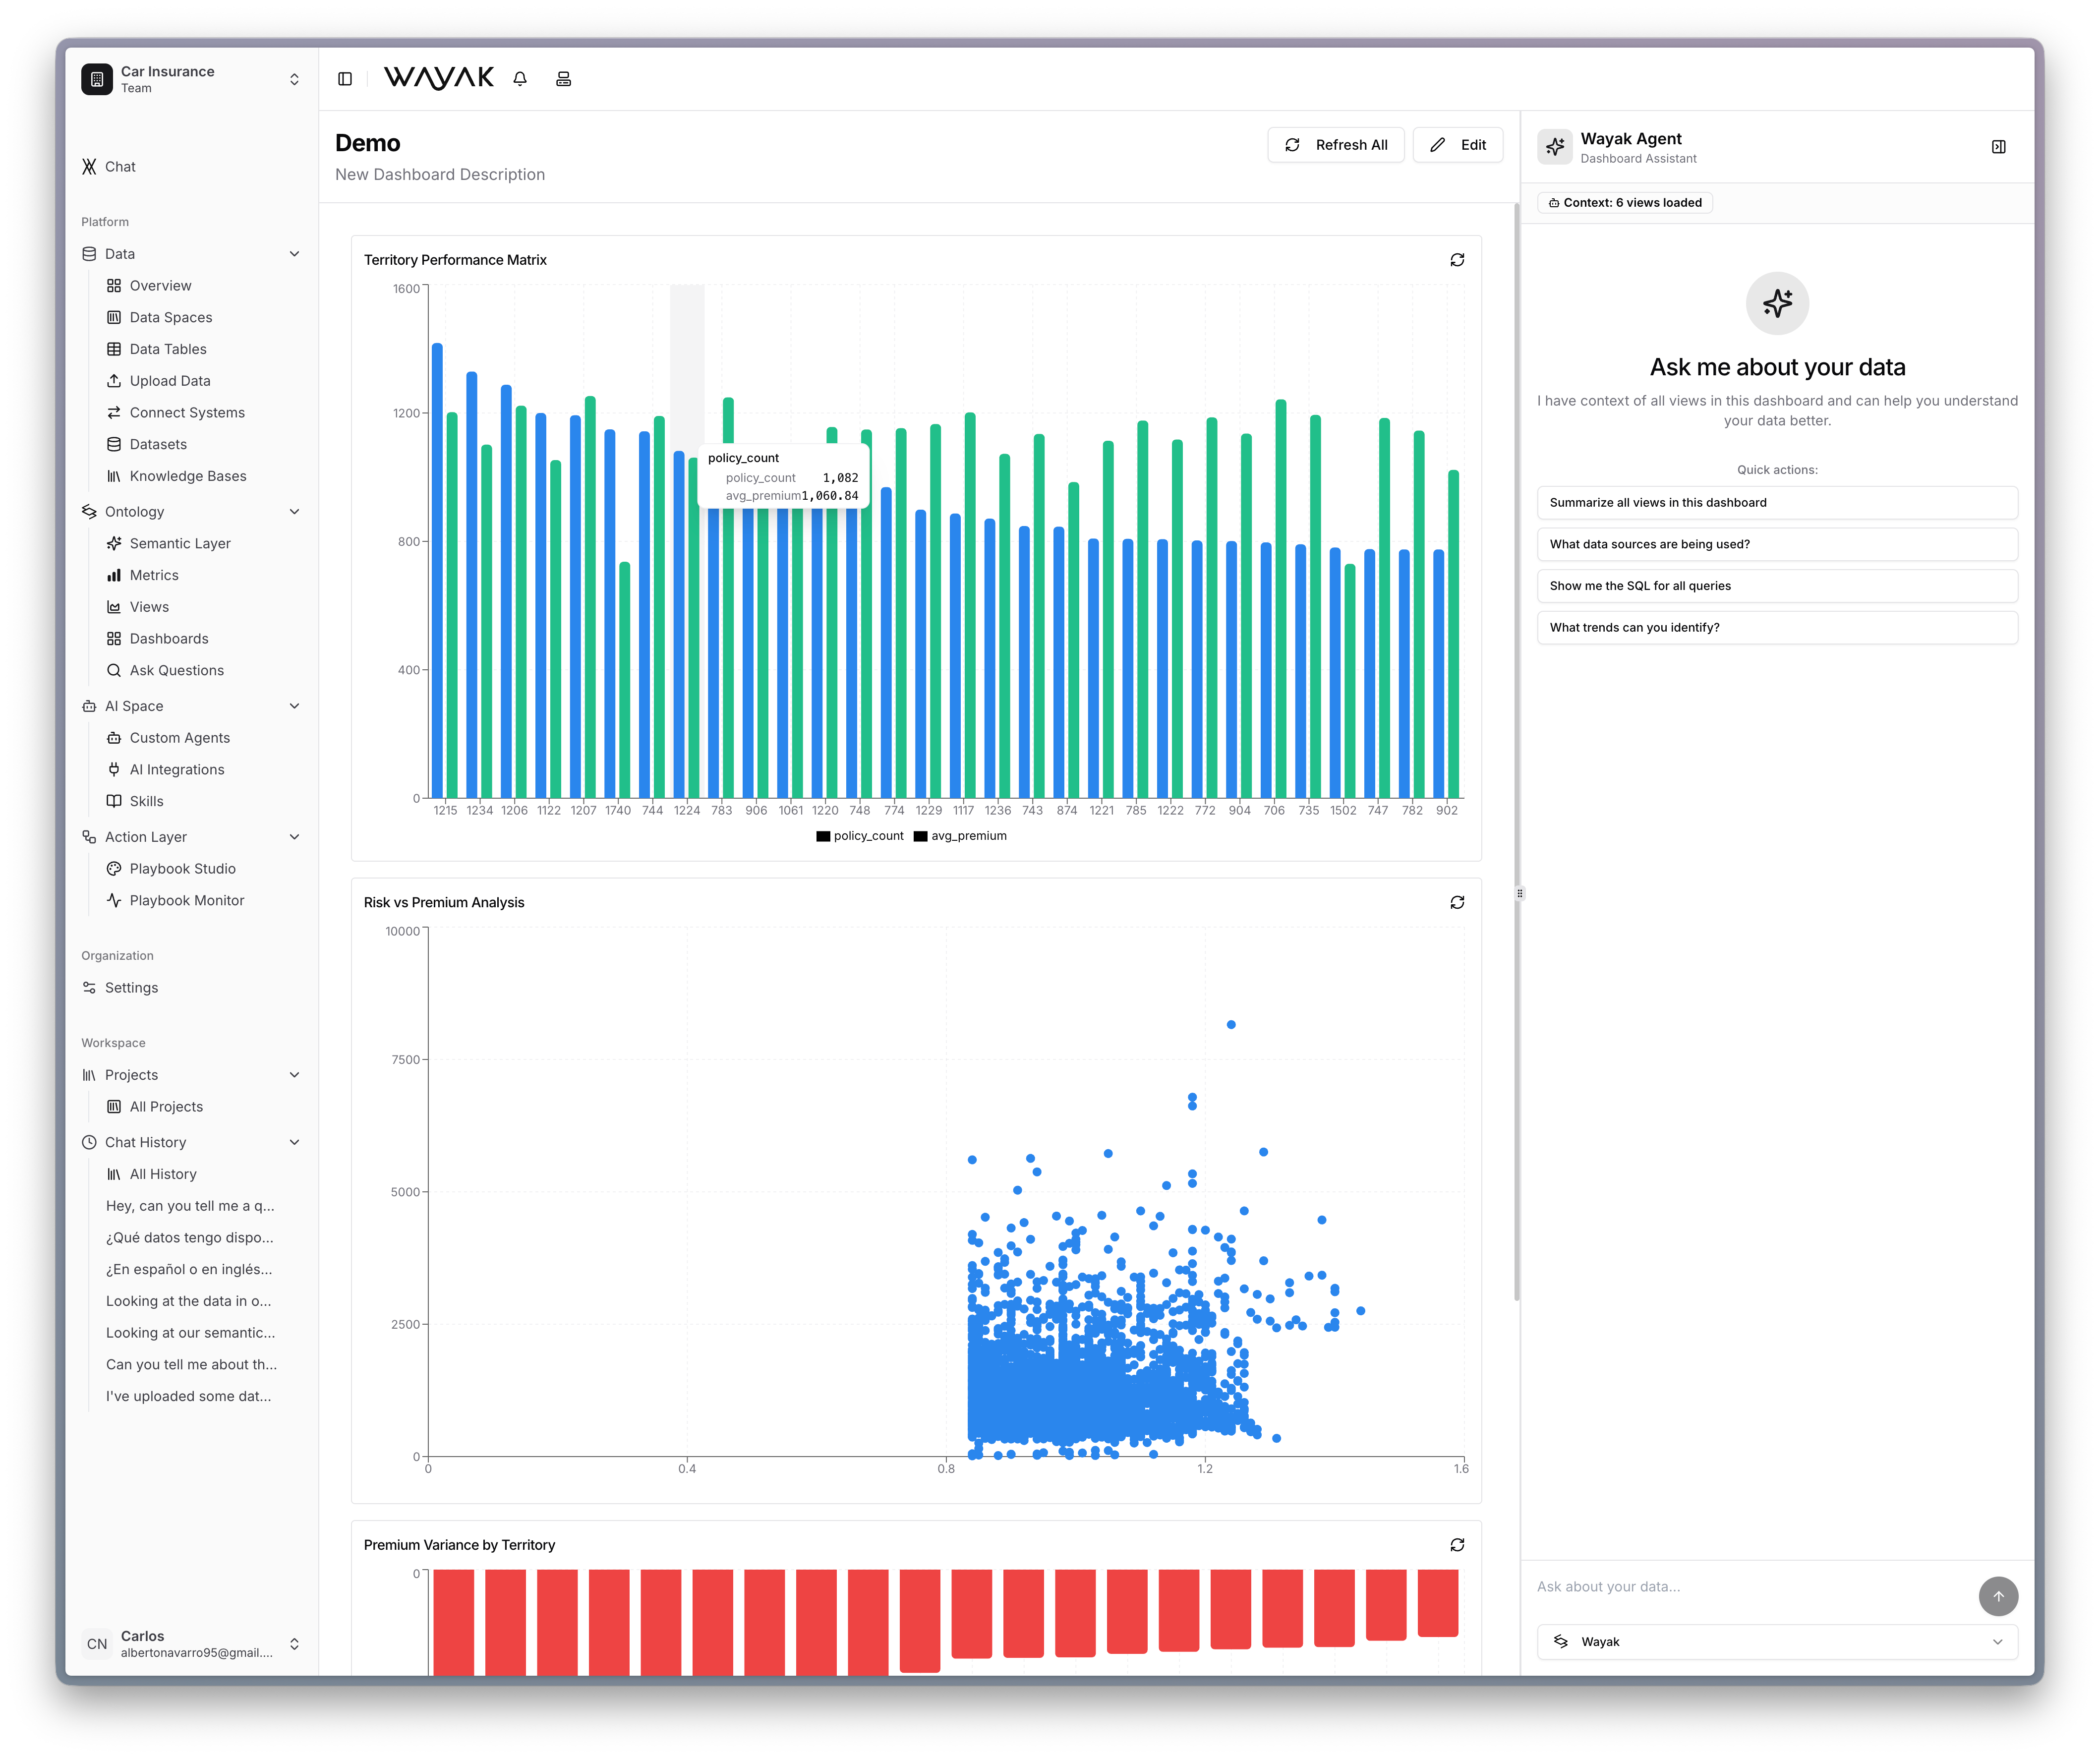
Dashboards are collections of views arranged into a single page. They give your team an at-a-glance picture of a topic — sales performance, operational health, customer activity, or anything else you want to monitor.
 ## What a dashboard is
A dashboard combines multiple views into one layout. Each view shows a different slice of data, and together they tell a complete story.
For example, a "Sales Performance" dashboard might include:
* A KPI card for total revenue this month
* A line chart of revenue over the last 12 months
* A bar chart of revenue by region
* A table of top 10 deals this quarter
## Building dashboards
1. Create the individual views you want to include
2. Create a new dashboard in the Wayak dashboard
3. Add your views and arrange them in a layout
4. Share the dashboard with your team
## Live data
Dashboards always show live data. Because views are built on your ontology and connected to your data sources, the numbers update automatically as your data changes.
## What a dashboard is
A dashboard combines multiple views into one layout. Each view shows a different slice of data, and together they tell a complete story.
For example, a "Sales Performance" dashboard might include:
* A KPI card for total revenue this month
* A line chart of revenue over the last 12 months
* A bar chart of revenue by region
* A table of top 10 deals this quarter
## Building dashboards
1. Create the individual views you want to include
2. Create a new dashboard in the Wayak dashboard
3. Add your views and arrange them in a layout
4. Share the dashboard with your team
## Live data
Dashboards always show live data. Because views are built on your ontology and connected to your data sources, the numbers update automatically as your data changes.