> ## Documentation Index
> Fetch the complete documentation index at: https://docs.wayak.io/llms.txt
> Use this file to discover all available pages before exploring further.
# Views
> Standalone charts and tables that visualize your data
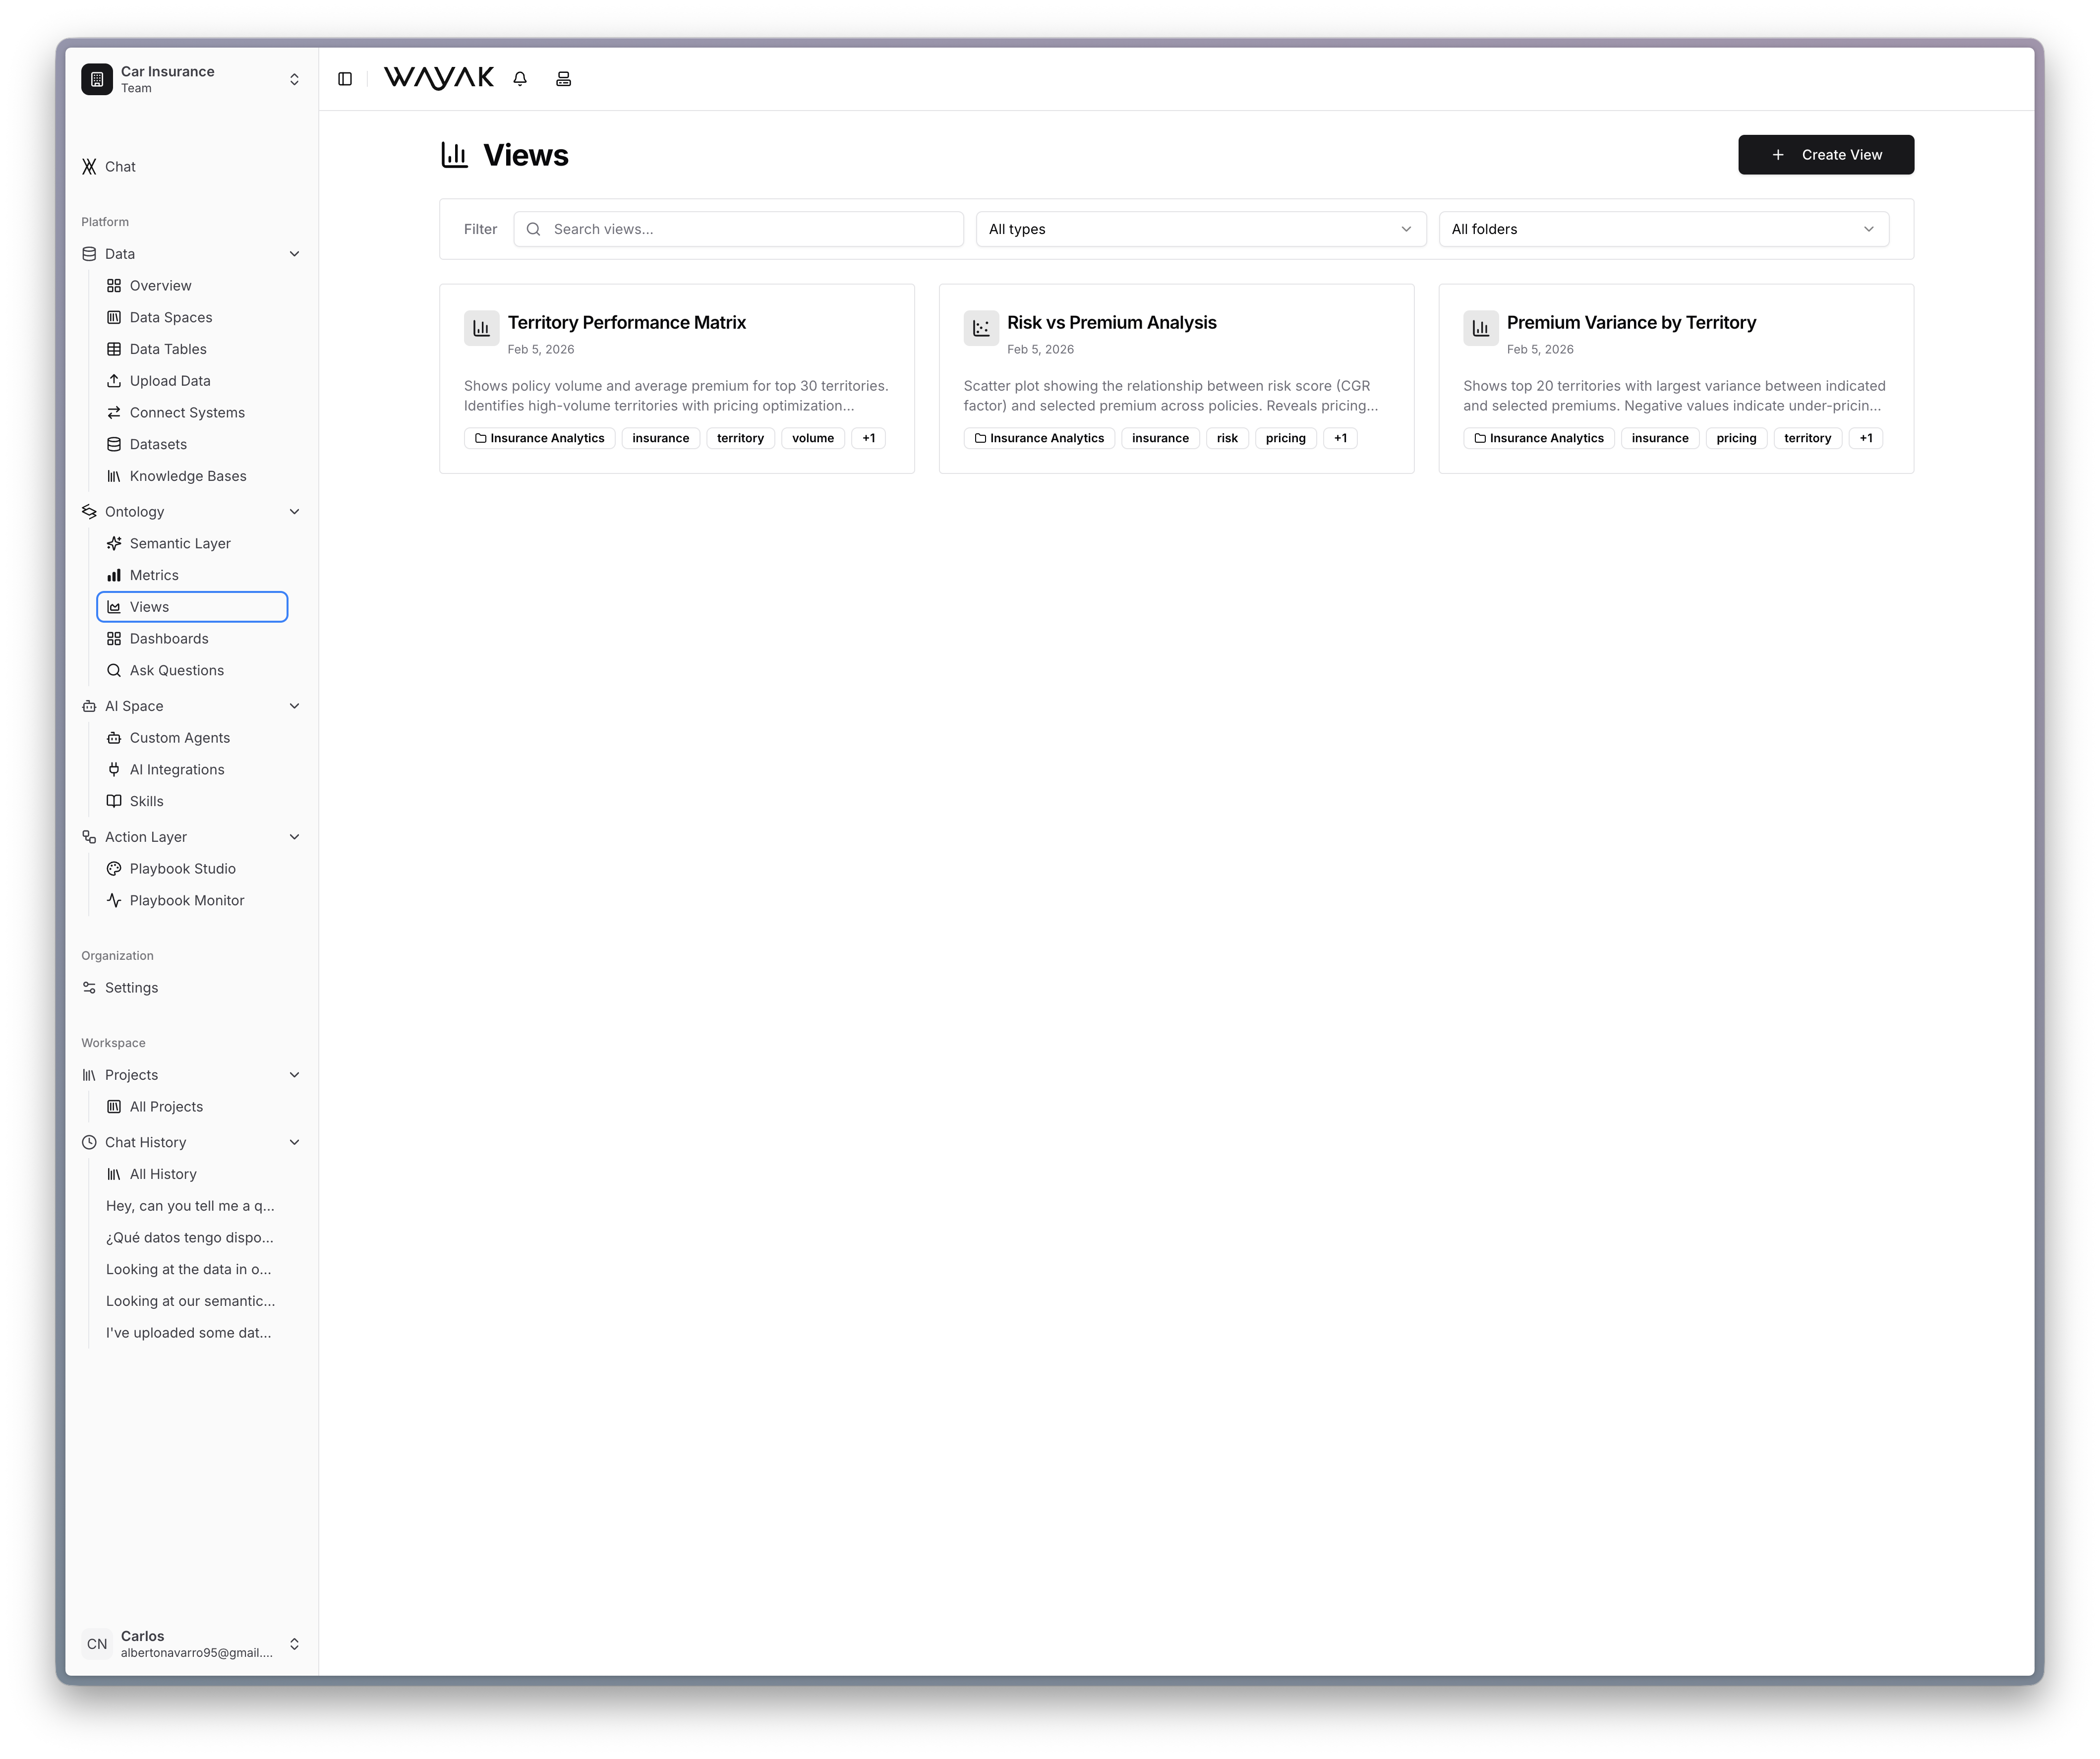
Views are individual visualizations — a chart, a table, a KPI card. Each view represents a specific slice of your data, defined by a combination of metrics, dimensions, and filters.
 ## What a view is
A view is a saved visualization that answers a specific question. It can be:
* A **line chart** showing revenue over time
* A **bar chart** comparing sales by region
* A **table** listing top customers by spend
* A **KPI card** displaying a single number like total active users
Views are standalone. You can use them on their own or combine them into dashboards.
## How views use the ontology
Views are built on top of your ontology definitions. A view references:
* **Metrics** — what to measure (revenue, count, average)
* **Dimensions** — how to break it down (by region, by month, by product)
* **Filters** — what to scope (last 90 days, active customers only)
Because views use your defined metrics, the numbers are always consistent with what the agent reports in conversation.
## Views vs. ad hoc answers
When you ask the agent a question in chat, it generates an answer on the fly. A view is a saved, reusable version of that answer — pinned so you can check it anytime without re-asking.
## What a view is
A view is a saved visualization that answers a specific question. It can be:
* A **line chart** showing revenue over time
* A **bar chart** comparing sales by region
* A **table** listing top customers by spend
* A **KPI card** displaying a single number like total active users
Views are standalone. You can use them on their own or combine them into dashboards.
## How views use the ontology
Views are built on top of your ontology definitions. A view references:
* **Metrics** — what to measure (revenue, count, average)
* **Dimensions** — how to break it down (by region, by month, by product)
* **Filters** — what to scope (last 90 days, active customers only)
Because views use your defined metrics, the numbers are always consistent with what the agent reports in conversation.
## Views vs. ad hoc answers
When you ask the agent a question in chat, it generates an answer on the fly. A view is a saved, reusable version of that answer — pinned so you can check it anytime without re-asking.