What a dashboard is
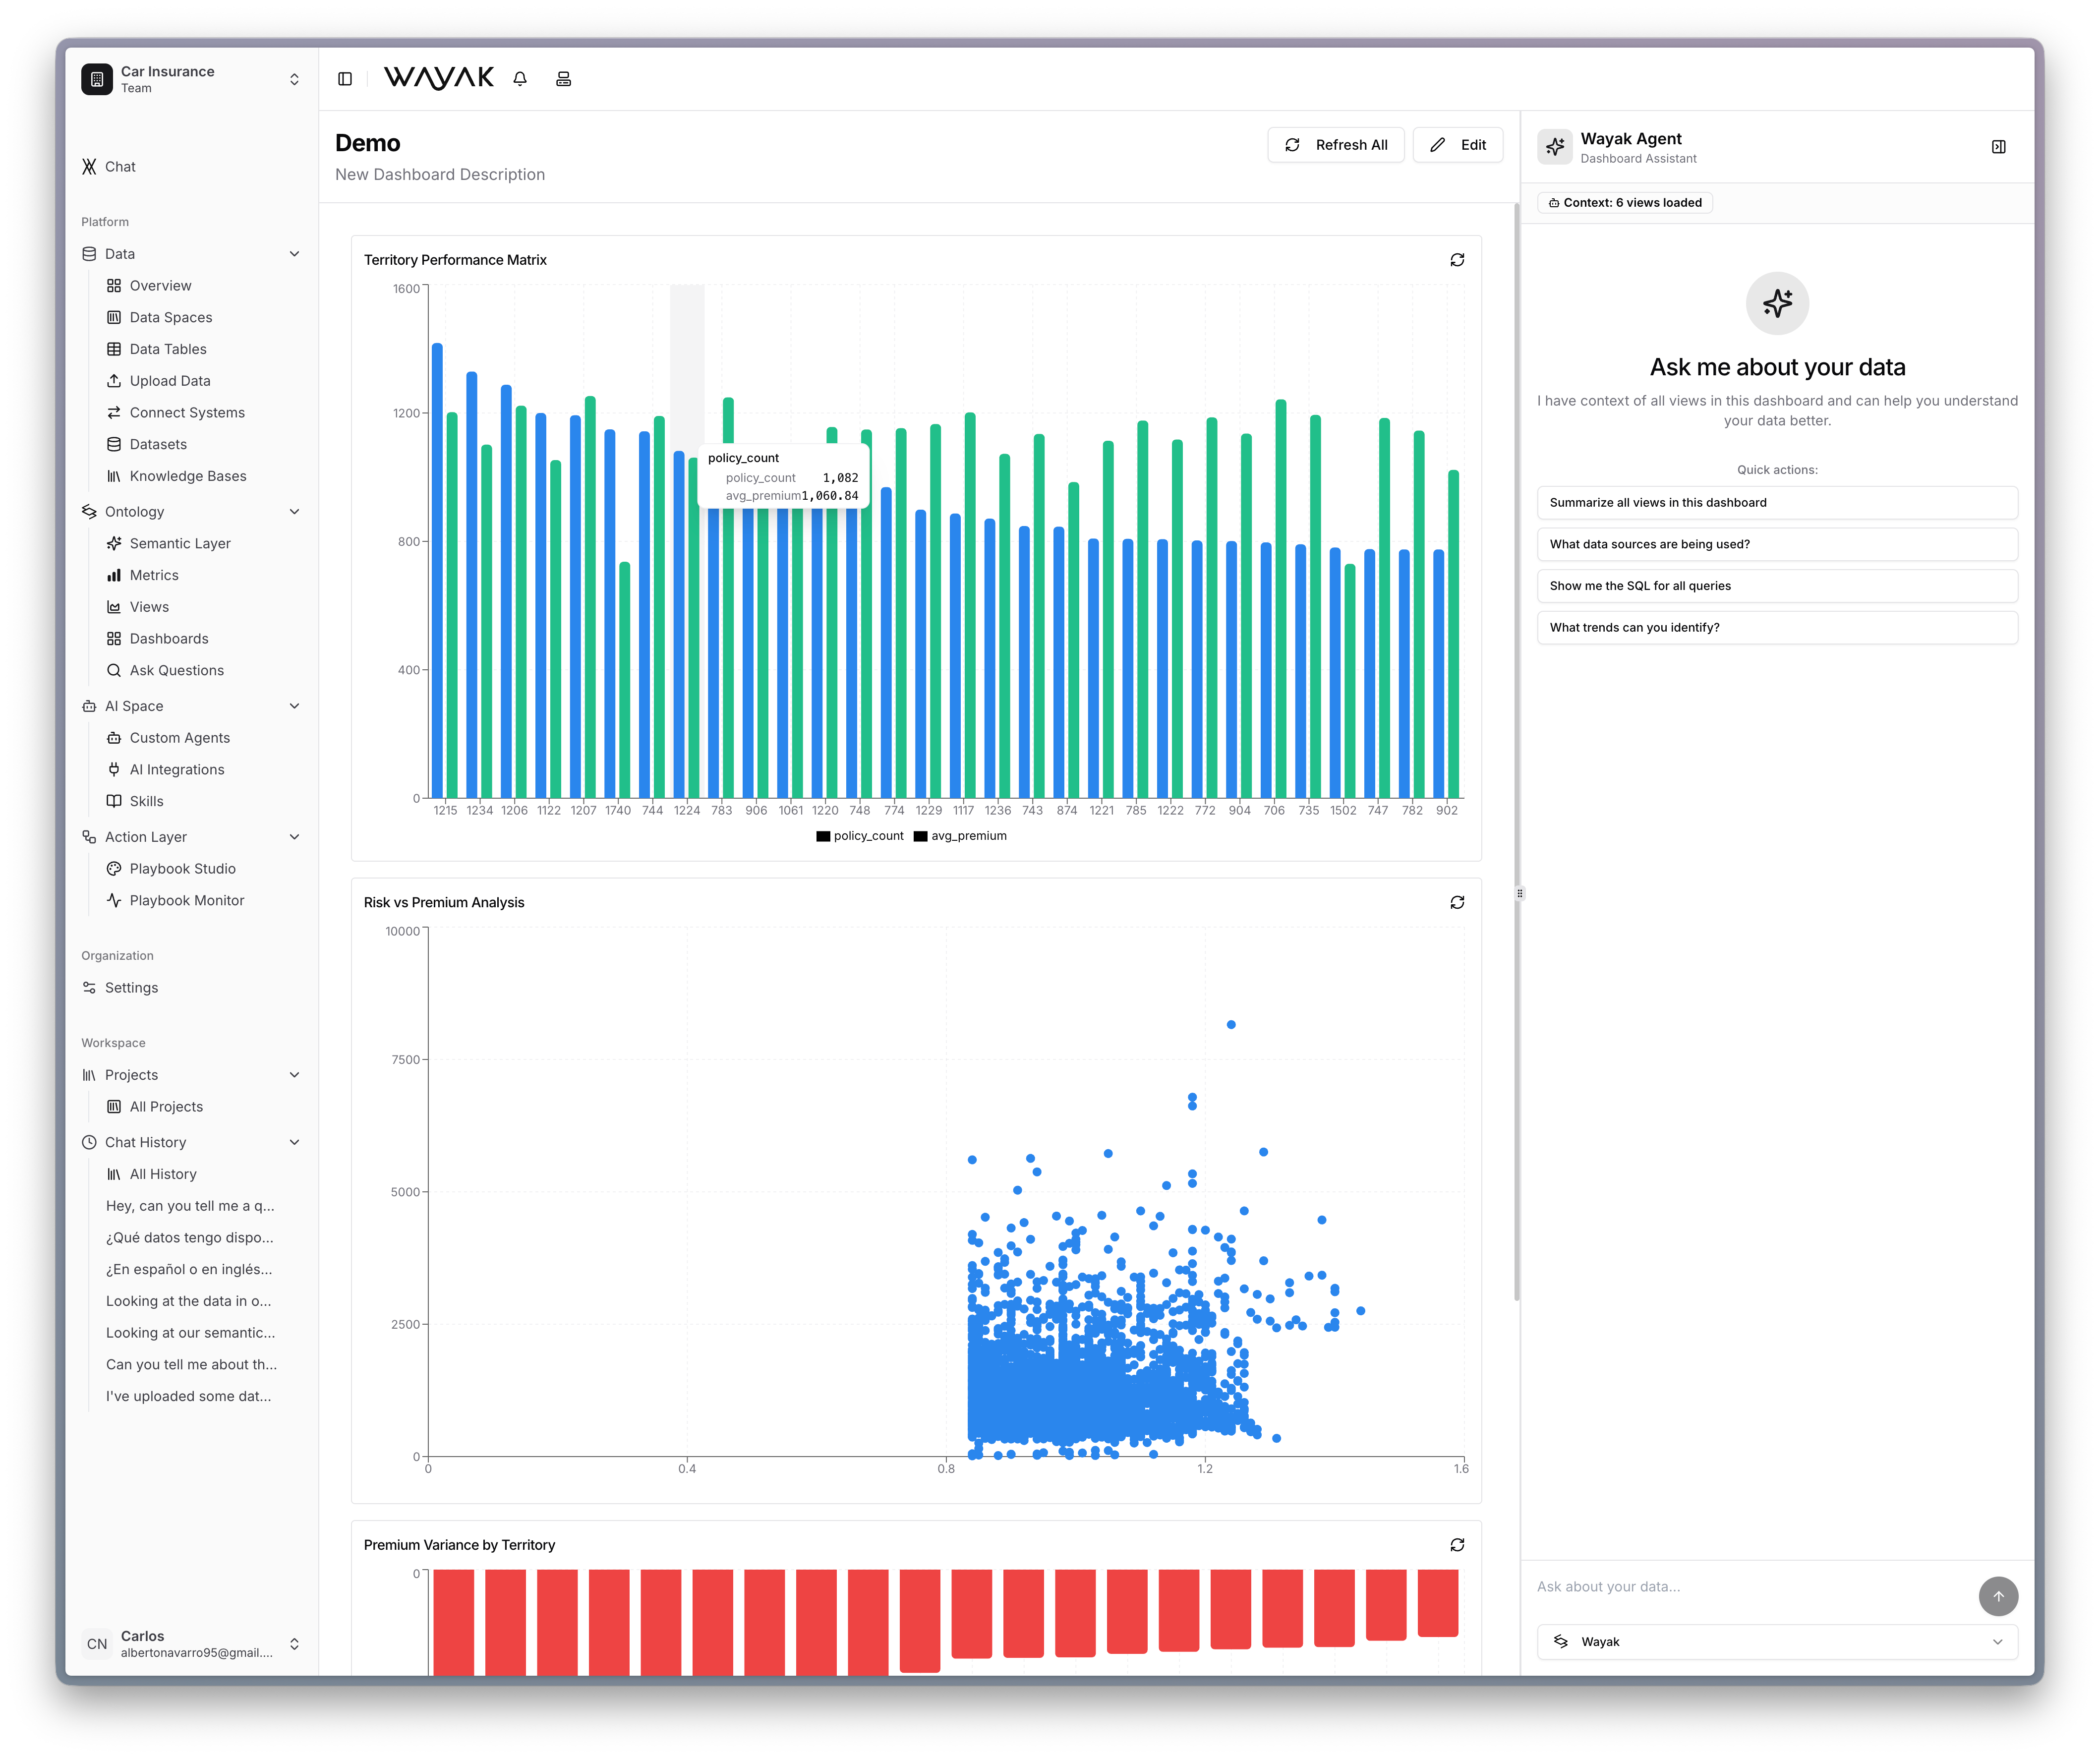
A dashboard combines multiple views into one layout. Each view shows a different slice of data, and together they tell a complete story. For example, a “Sales Performance” dashboard might include:- A KPI card for total revenue this month
- A line chart of revenue over the last 12 months
- A bar chart of revenue by region
- A table of top 10 deals this quarter
Building dashboards
- Create the individual views you want to include
- Create a new dashboard in the Wayak dashboard
- Add your views and arrange them in a layout
- Share the dashboard with your team